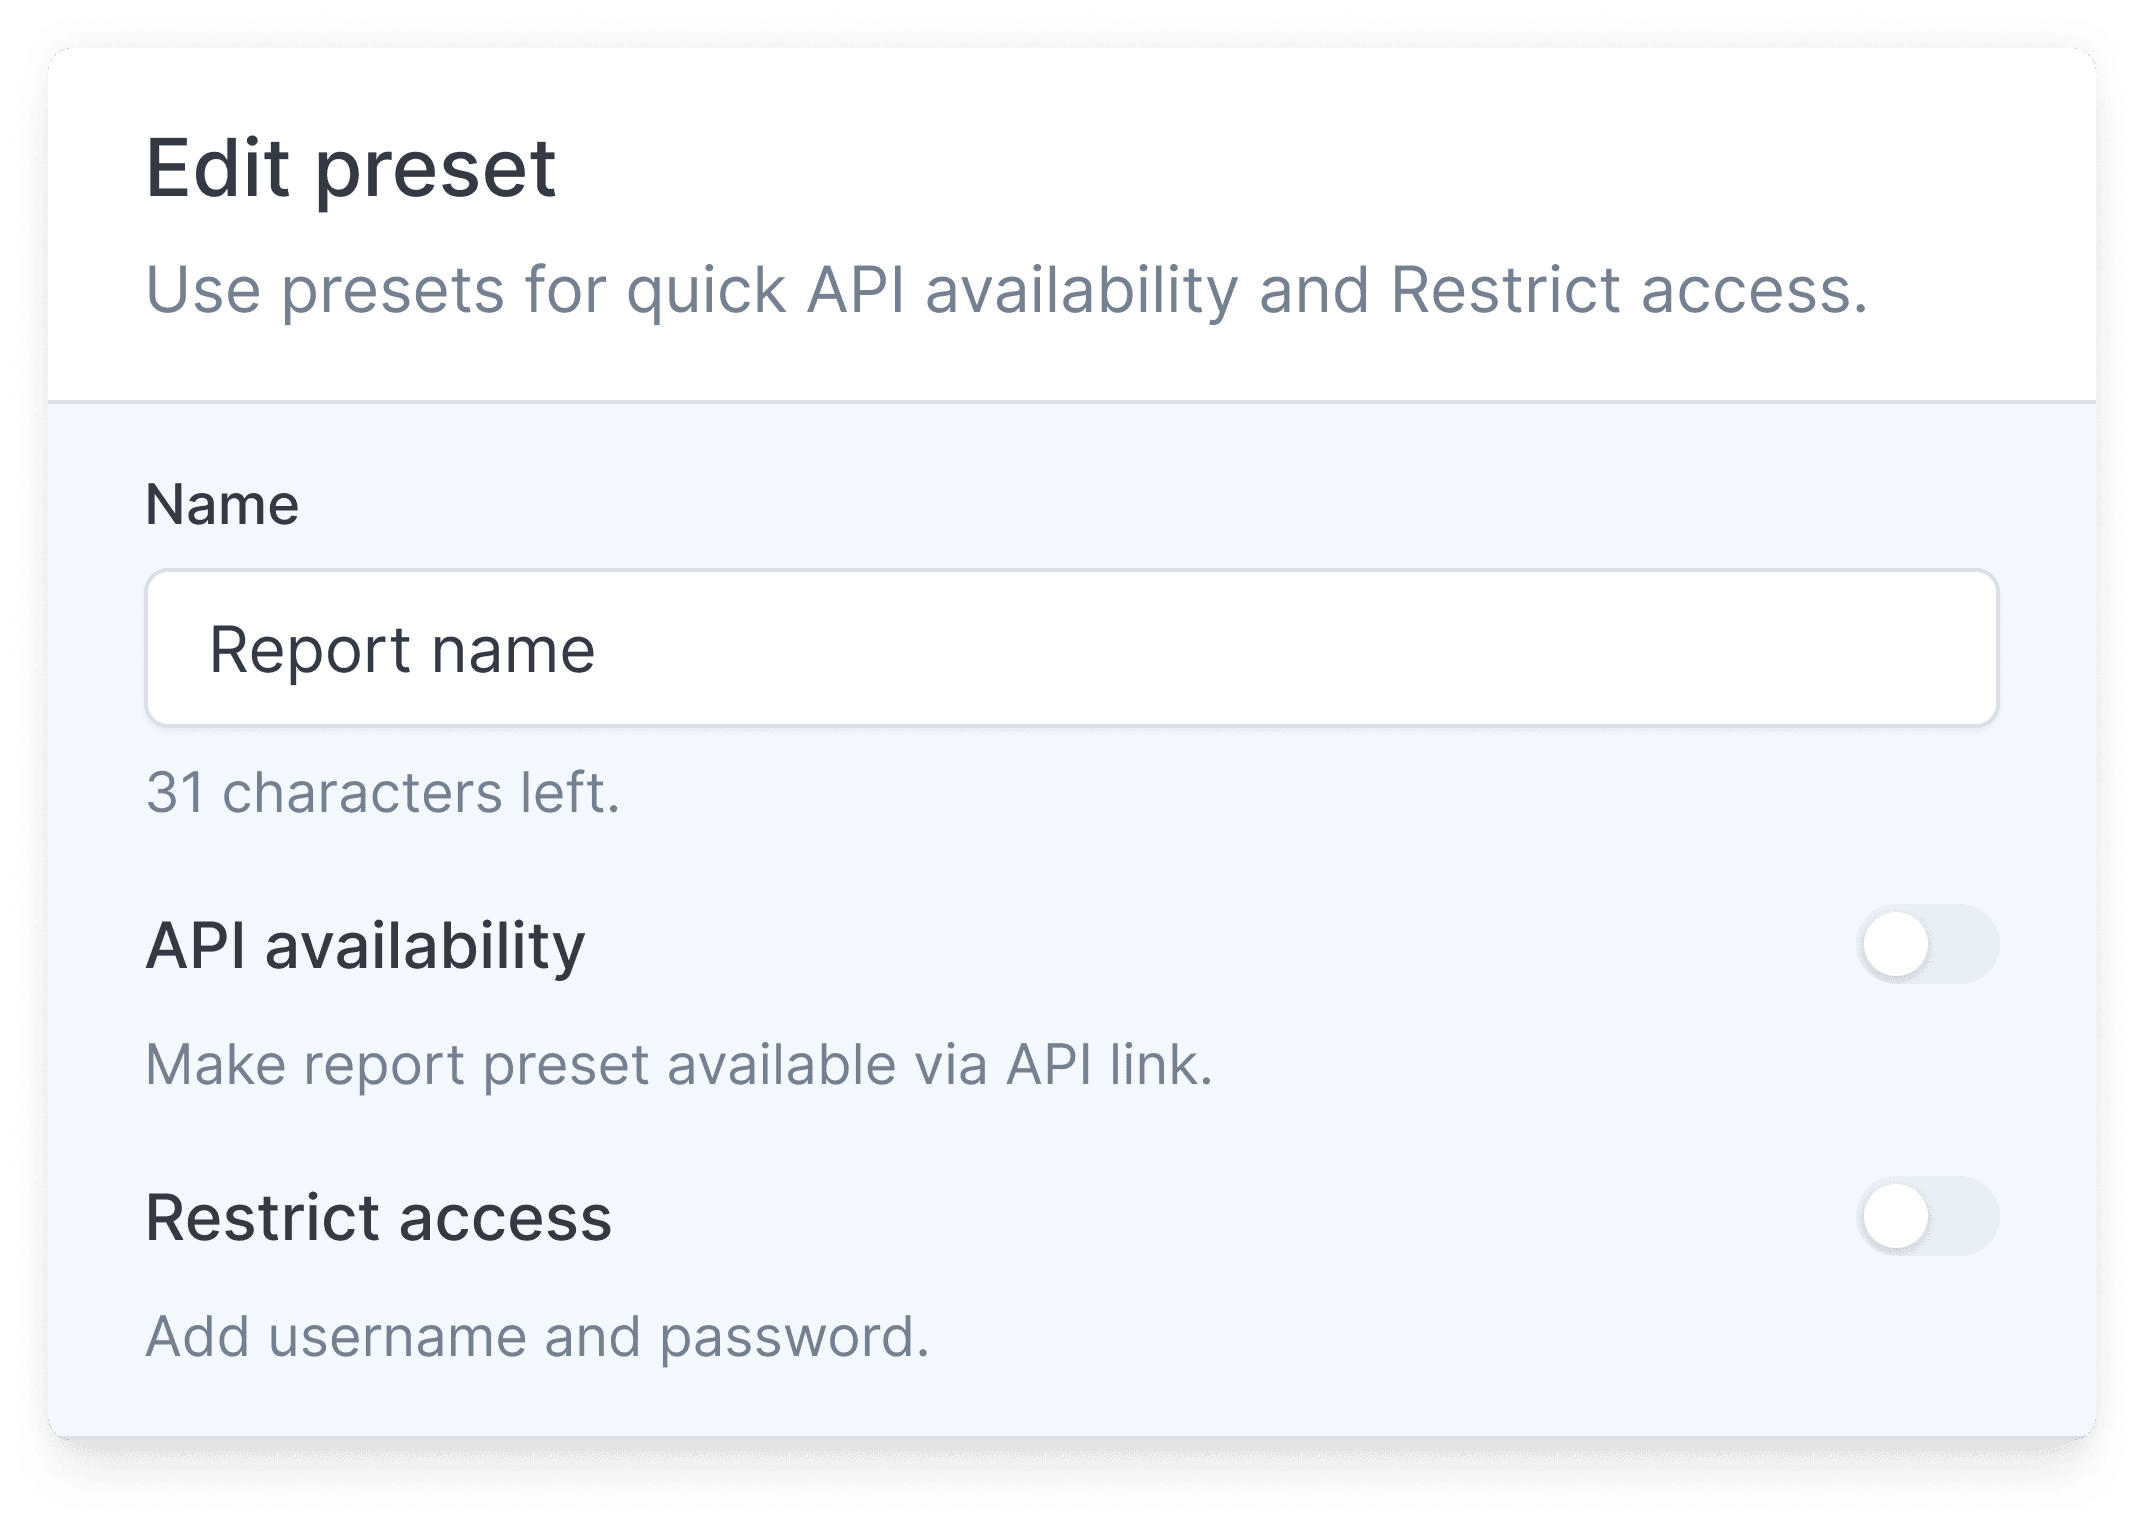
Pick the angle. Save the view.
Hit it via API
Skip the fifty useless dashboards. ReferOn gives you a focused set of reports, each designed to answer a specific business question. The same data your team sees — updated fresh on every call.
The pivot
One question.
Endless angles
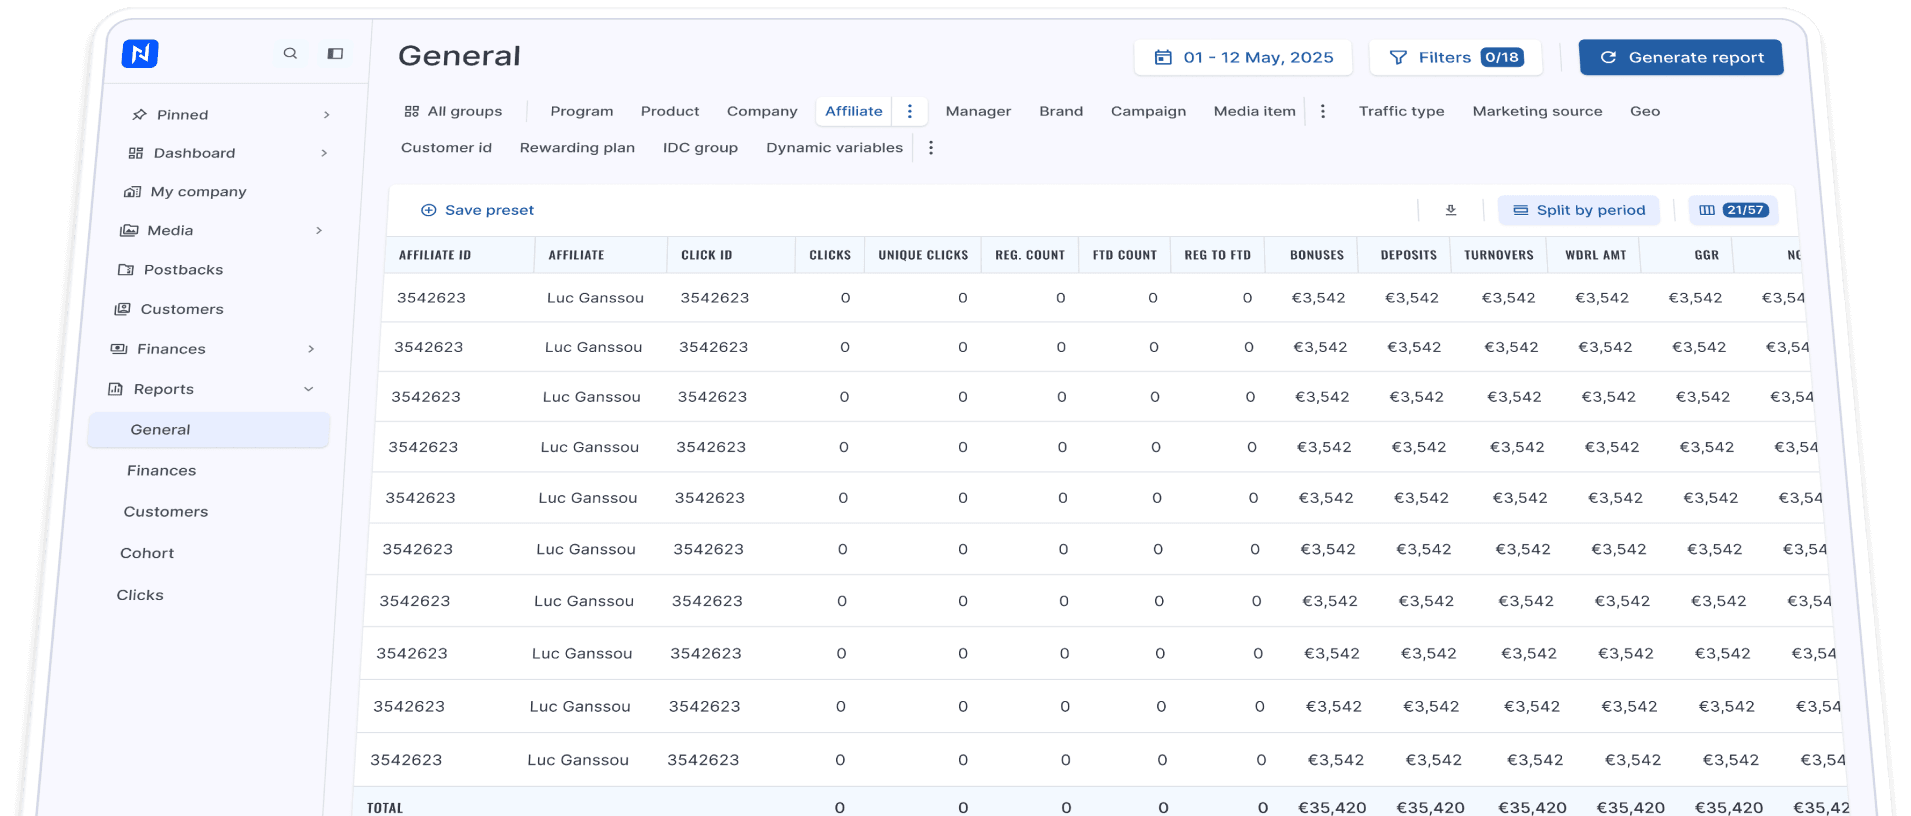
How is your program performing? Pivot operational data by program, brand, affiliate, GEO, or traffic type — standalone or stacked. Get full per-player, per-day visibility, with Fixed Fees automatically distributed across players and days.
 Switch breakdown
Same source data, instant re-aggregation. Switch breakdowns without re-running queries. Drill down to RevShare, CPA, CPC, Fixed Fee, Deductions, RS Distribution, Reward Commission, and Total Reward per row — and save any view as a preset.
Financial truth
Where every euro is,
right now
Separate database. Built-in automated accounting.
Track every reward through every state: earned, processing, paid, balance. Filter by transaction method or affiliate payment method. Reconcile in one click.
Reward created
Fully settled
Stage 1 of 3
TTL Reward €428,150
Total earned by affiliates over the period
Stage 2 of 3
TTL Processing €146,720
In the payment pipeline, not yet settled
Stage 3 of 3
TTL Paid €271,310
Completed transactions by method
Slice and dice your financial data effortlessly
Pivot finance data by program, company, affiliate, brand, manager, campaign, traffic type, or marketing source. Then narrow by payment method, both at the transaction level and the affiliate’s preferred channel


Program
Brand
Campaign
Marketing source
Affiliate
Traffic type
Manager
Transaction payment method
Affiliate payment method
Player registry
Every player.
50 columns of detail
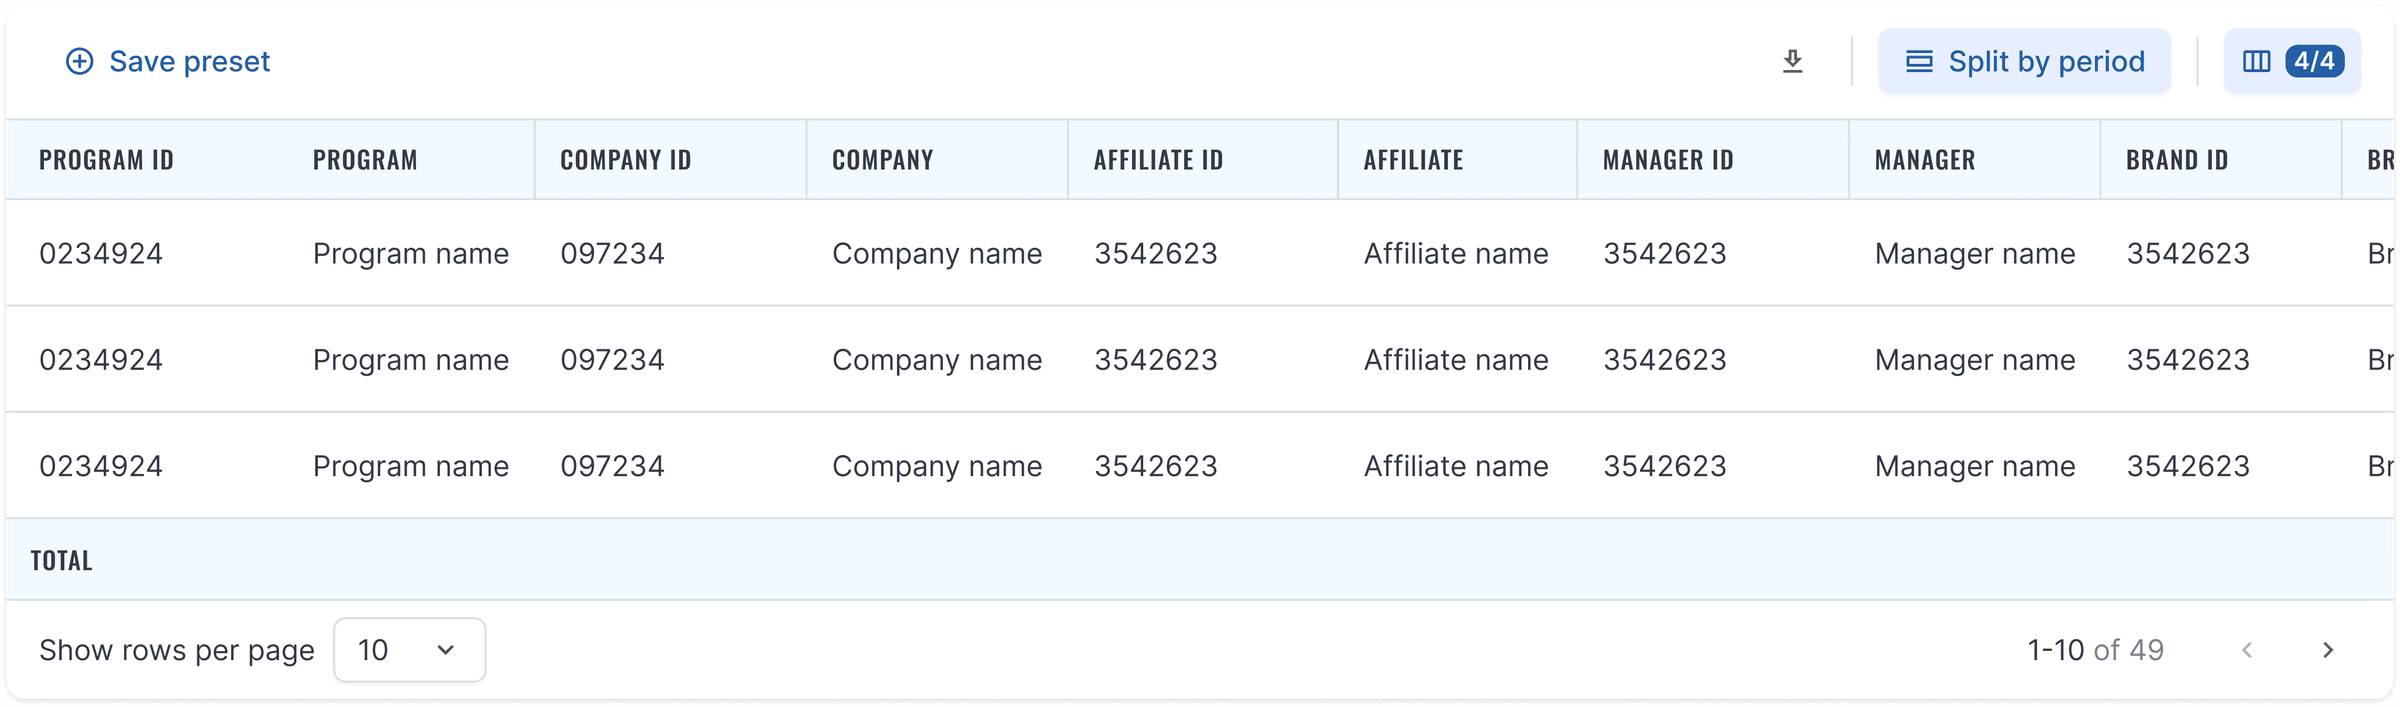
A complete customer registry. Track gender, birth date, GEO, IP, signup date, company affiliation, assigned program, and every dynamic variable captured at click time. Search by Customer ID username or fluid. Search placeholder: Find by Customer ID, Username, subID.
Clickstream
Second-by-second.
Forensic when needed
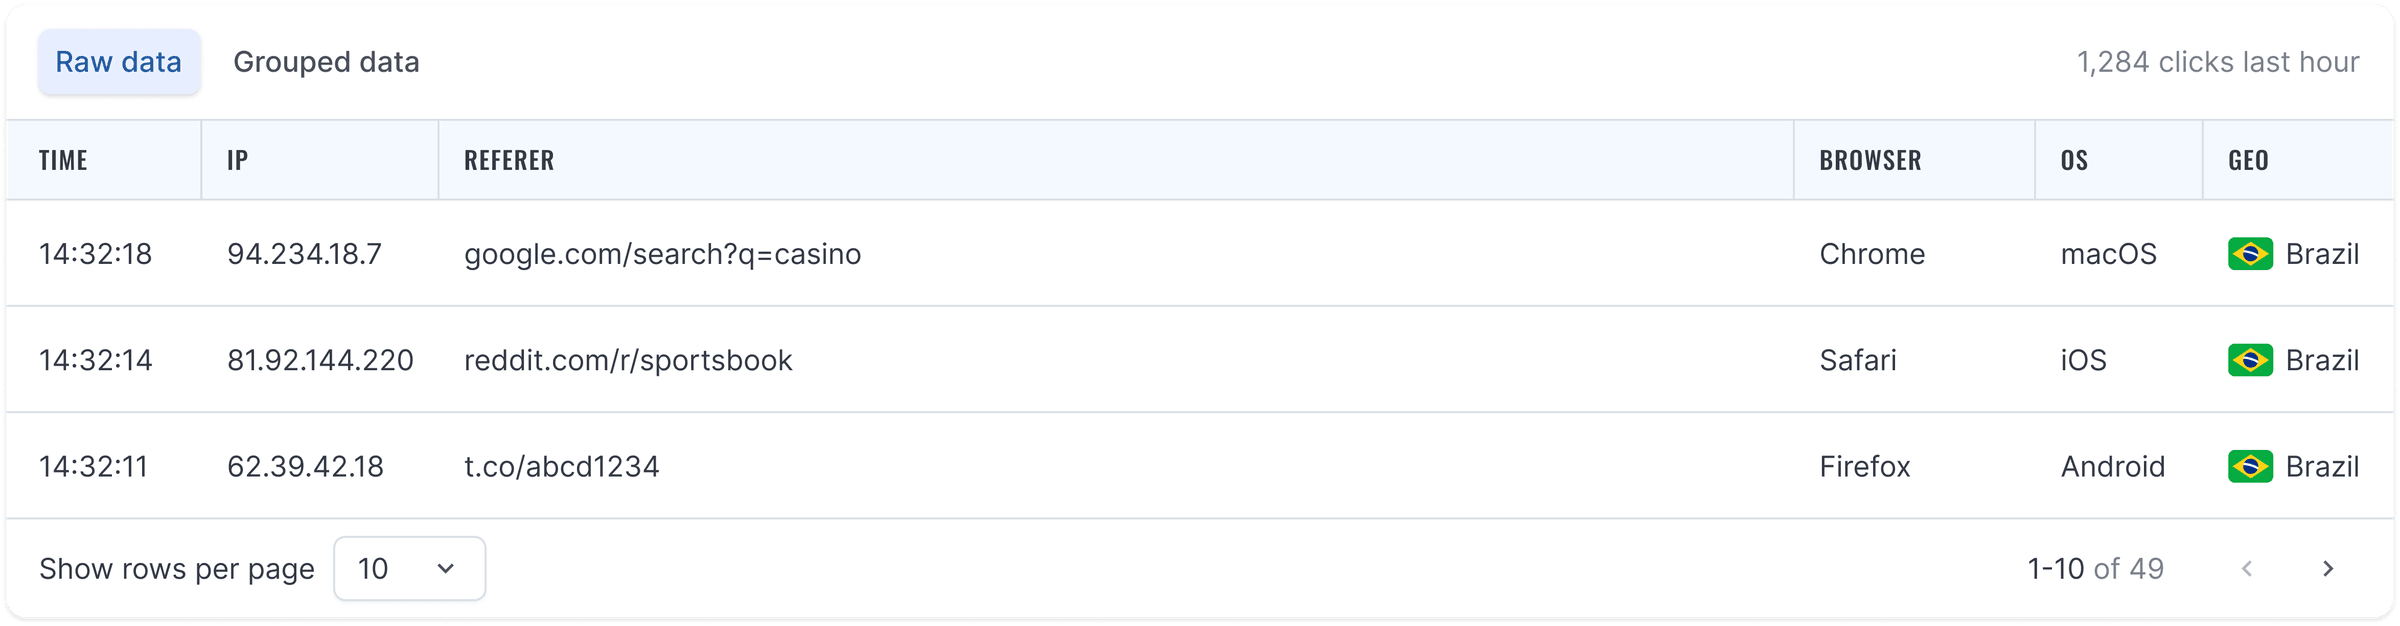
Separate database. Every click captured in raw form: referrer URL, user agent, IP, browser, OS, and device. Group by any dimension for a quick summary, or drop back to raw rows when something looks off.
Cohort
How players age
in your funnel
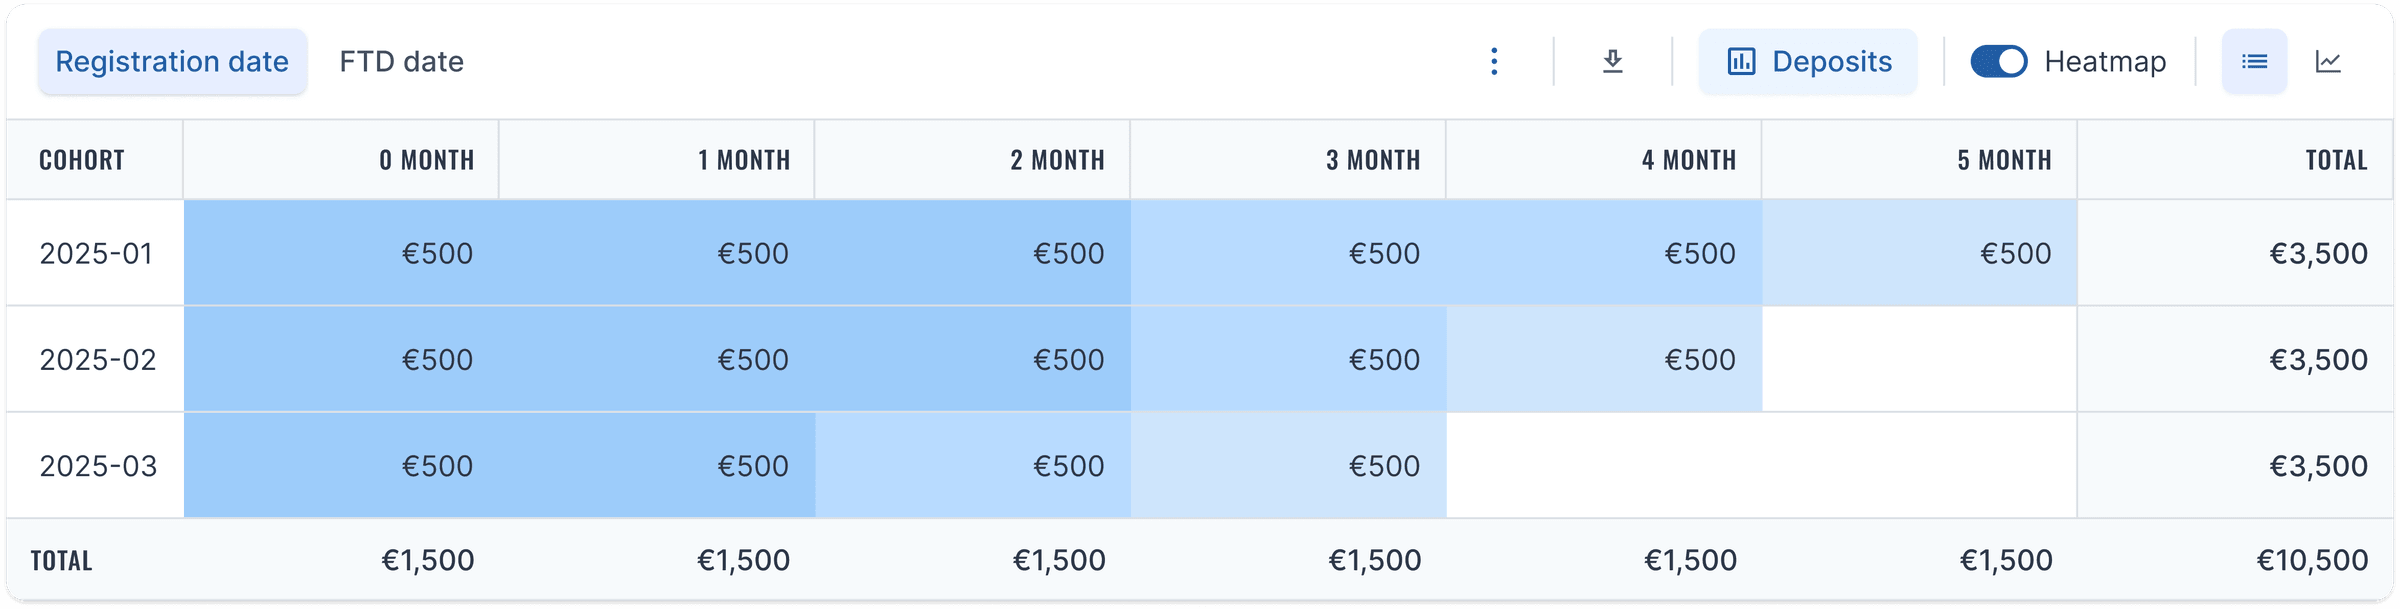
Group customers by registration month or FTD month. Track each cohort month by month, from 0 through 12 and beyond. Heatmap mode instantly highlights where retention drops, while easy toggles let you switch between active player counts and revenue metrics.
Save and share — presetS
Save any view.
Hit it via API
Found a useful breakdown? Save it as a preset, toggle API access, and generate a fresh data link. Secure it with a username and password if needed. Anyone — or any system — with the link gets that exact view, updated on every call.